


Super Micro Computer, Inc. (SMCI) stock surged over 50% after reporting earnings last week. The top and bottom line results weren’t stellar. The guidance, however, was enough to fuel a buying frenzy, driving the stock’s rally to a 110% gain this month. But is it sustainable? Once SMCI pulls back, does it have the technical strength and fundamental conditions to make it a favorable trade?
SMCI set its revenue guidance to $40 billion by 2026, an ambitious target. Many analysts are skeptical, with several maintaining their “underweight” rating. Investors, on the other hand, are jumping in regardless, betting on increased AI infrastructure spending, particularly among giants like Meta (META), Amazon (AMZN), Alphabet (GOOGL), and Microsoft (MSFT).
With bulls and bears divided, what do the technicals say? What entry points and targets might the price action give us, if any?
Let’s get started. Below is a weekly chart detailing SMCI’s two-year price action.
FIGURE 1. WEEKLY CHART OF SMCI STOCK. The stock saw an impressive rise followed by an equally strong fall. Can it sustain its recovery? Chart source: StockCharts.com. For educational purposes.
From May 2023 to March 2024, SMCI saw a jaw-dropping rally of 1,167% from around $10 a share to $120. But then, it all came to a screeching halt as financial and regulatory concerns — specifically allegations of accounting and transaction irregularities — sent the stock into a prolonged tailspin. Over nearly a year of selling pressure, SMCI plummeted, finally hitting rock bottom at $23 in November.
Since then, SMCI has been attempting to recover, twice testing and finally breaking above resistance at the $50 range (see the highlighted yellow range). Interestingly, despite its year-long plunge, it still outperformed its broader industry, represented by the Dow Jones US Computer Hardware Index ($DJUSCR), by $297%.
So, what does the situation look like up close, and might there be an entry point? Let’s now shift over to a daily chart.
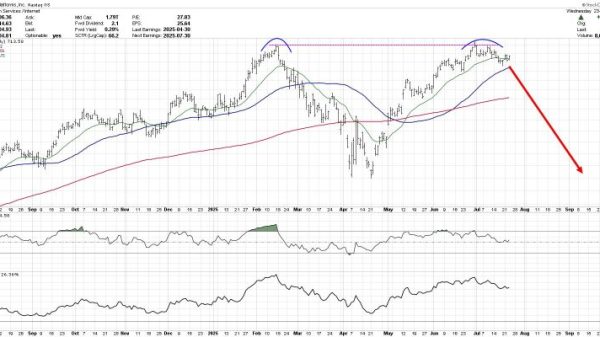
FIGURE 2. DAILY CHART OF SMCI STOCK. The trend is shifting, so it’s important to watch the key levels and momentum shift via the full stochastic oscillator. Chart source: StockCharts.com. For educational purposes.
First, note how the StockCharts Technical Rank (SCTR) score jumped well above the bullish 70-line. The shift from extreme technical weakness to technical strength potentially foreshadows a bullish shift in the trend. But it depends on how price responds to a few key levels.
The price looks a bit overextended. While runaway gaps tend not to get filled immediately within a week after the move, there’s still the likelihood that a pullback may occur in the next few sessions. The Stochastic Oscillator is well above 80, signaling a potentially overbought condition, although both lines (%K and %D) have been known to occasionally hover in either extreme (above 80 and below 20) for a prolonged period.
About the stochastic oscillator, note how it signaled the (overbought) limit of each major swing high during the downtrend. If SMCI’s trend shifts upward, you will use the oscillator to anticipate potential swing lows throughout the uptrend.
Concerning the trend, look at the ZigZag line highlighting the stock’s major swing points. For the bullish reversal to evolve into a full-fledged uptrend, it should remain above the most recent swing low point (see blue dotted line) near $25. Before that, however, SMCI may rebound at the recently breached resistance level (yellow line). If it drops below this level, the next potential support is around $37.50 (blue line), which has acted as both support and resistance from last September to this February.
At the Close
If you’re considering a position in SMCI, here are your next steps:
- Add SMCI to your ChartLists.
- Monitor price action if SMCI pulls back, paying close attention to how it reacts to the key levels mentioned above.
A bounce off support could indicate a favorable entry point. However, if the price falls below $25, the bullish outlook becomes uncertain. A drop below $17.50 would invalidate the bullish thesis entirely.
Disclaimer: This blog is for educational purposes only and should not be construed as financial advice. The ideas and strategies should never be used without first assessing your own personal and financial situation, or without consulting a financial professional.